Simulation 0002
Metadata Field |
Value |
|---|---|
Simulation ID |
0002 |
Name |
q1_aligned_chi0_2 |
Mass Ratio |
1 |
Spin 1 |
(0, 0, 0.2) |
Spin 2 |
(0, 0, 0.2) |
Final Mass |
0.946 |
Final Spin |
0.746 |
Spherical harmonics (included in the fits):
[(2, 2), (3, 2), (4, 2)]
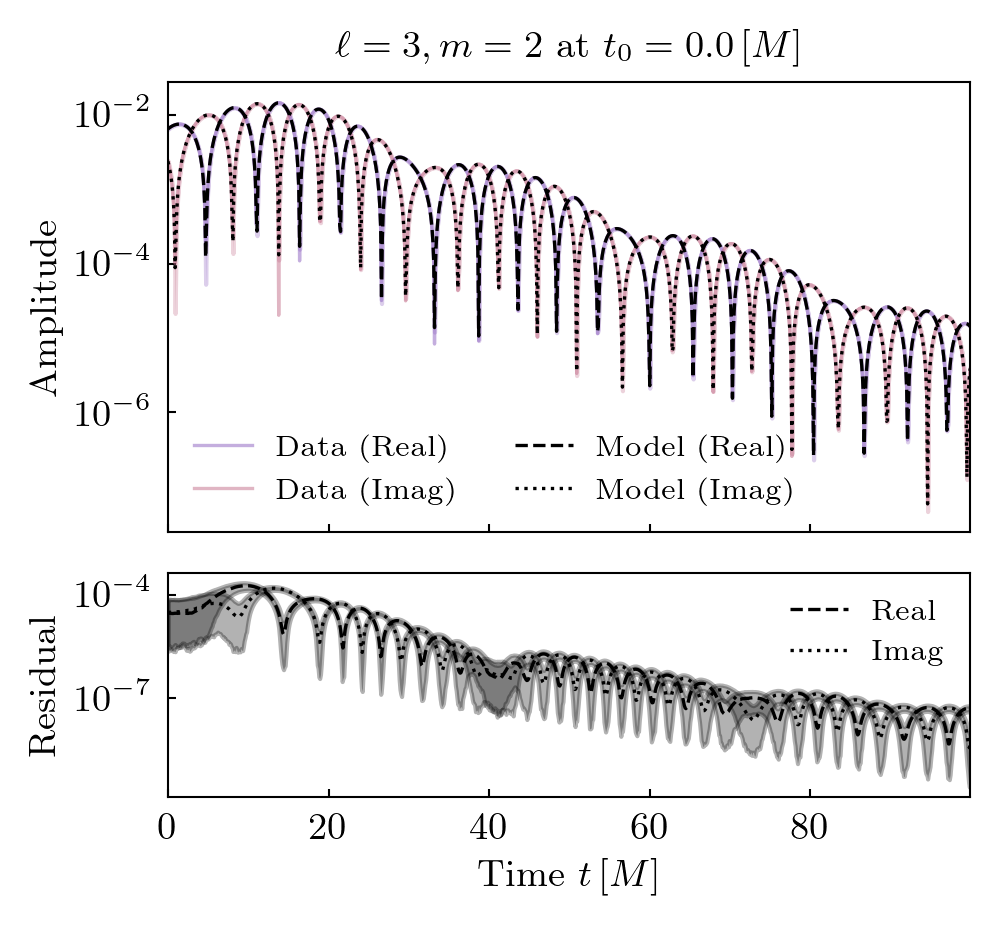
Target harmonics (included in the figures):
[(2, 2), (3, 2)]
Candidate modes considered:
Tuples of length 2 / 4 / 8 / 12 are constant terms / QNMs / quadratic QNMs / cubic QNMs.
[(2, 2, 0, 1), (2, 2, 1, 1), (2, 2, 2, 1), (2, 2, 3, 1), (2, 2, 4, 1), (2, 2, 5, 1), (2, 2, 6, 1), (3, 2, 0, 1), (3, 2, 1, 1), (3, 2, 2, 1), (3, 2, 3, 1), (3, 2, 4, 1), (3, 2, 5, 1), (3, 2, 6, 1), (4, 2, 0, 1), (4, 2, 1, 1), (4, 2, 2, 1), (4, 2, 3, 1), (4, 2, 4, 1), (4, 2, 5, 1), (4, 2, 6, 1), (2, 2, 0, -1), (2, 2, 1, -1), (2, 2, 2, -1), (2, 2, 3, -1), (2, 2, 4, -1), (2, 2, 5, -1), (2, 2, 6, -1), (3, 2, 0, -1), (3, 2, 1, -1), (3, 2, 2, -1), (3, 2, 3, -1), (3, 2, 4, -1), (3, 2, 5, -1), (3, 2, 6, -1), (4, 2, 0, -1), (4, 2, 1, -1), (4, 2, 2, -1), (4, 2, 3, -1), (4, 2, 4, -1), (4, 2, 5, -1), (4, 2, 6, -1), (2, 2), (3, 2), (4, 2)]
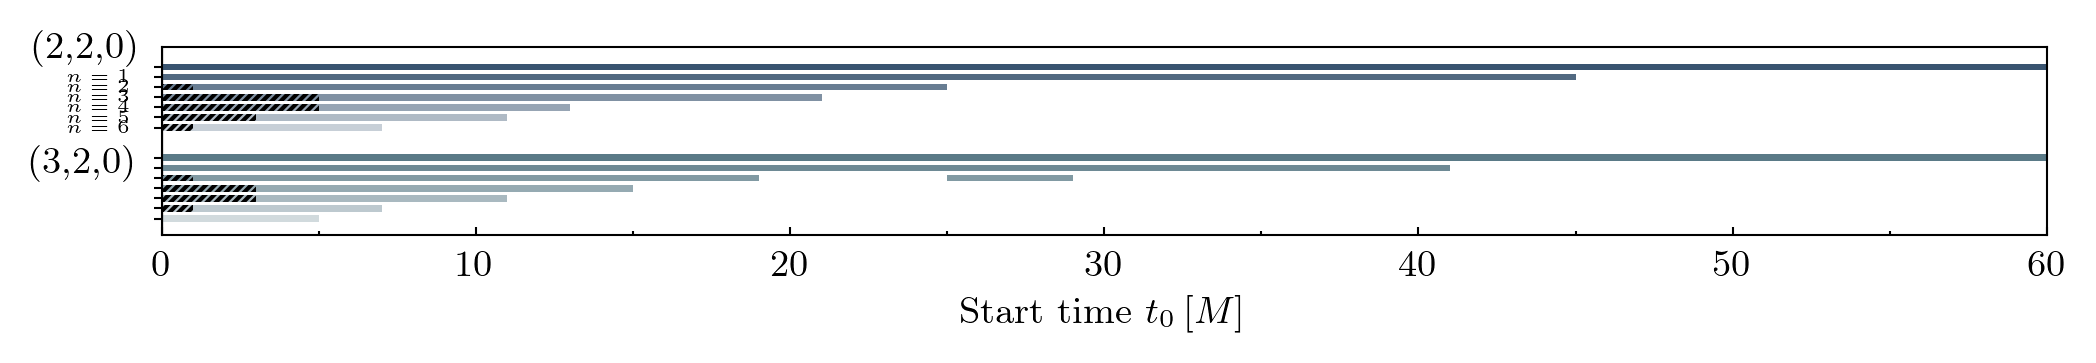
Mode Content
Times QNMs are present is shown below. Solid lines indicate prograde modes, hatched lines indicate retrograde modes. Vertical grey shaded regions (where present) show poor fit times.
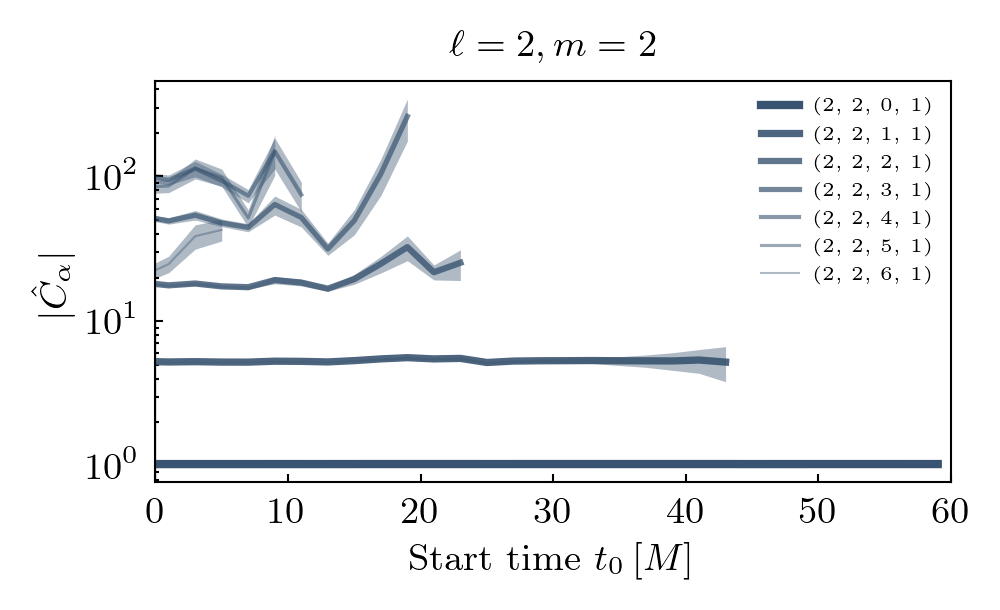
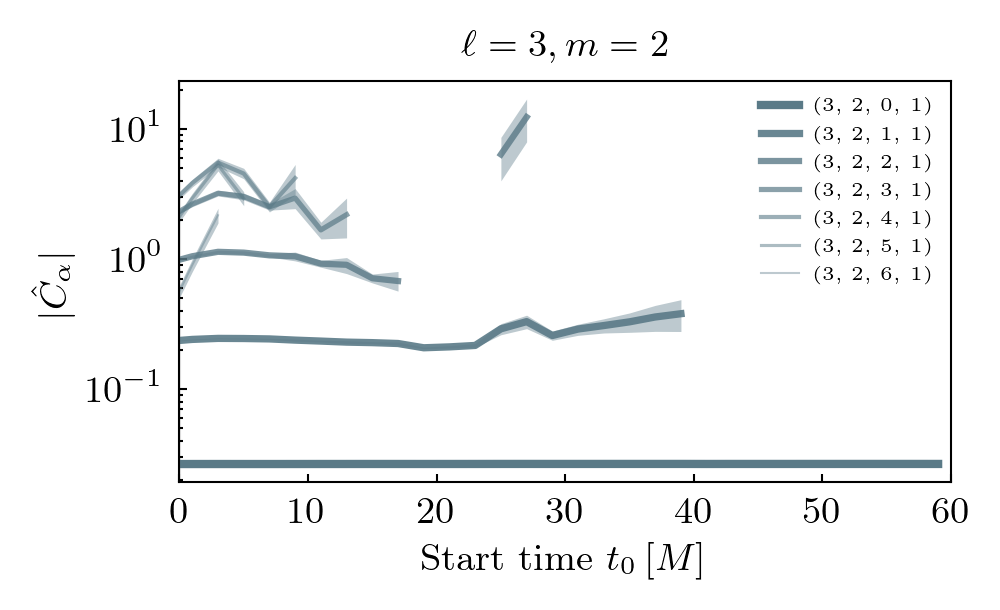
Amplitude Stability
Decay-corrected amplitudes are shown with the median as a bold line and 90% region shaded. Vertical grey shaded regions (where present) show poor fit times.
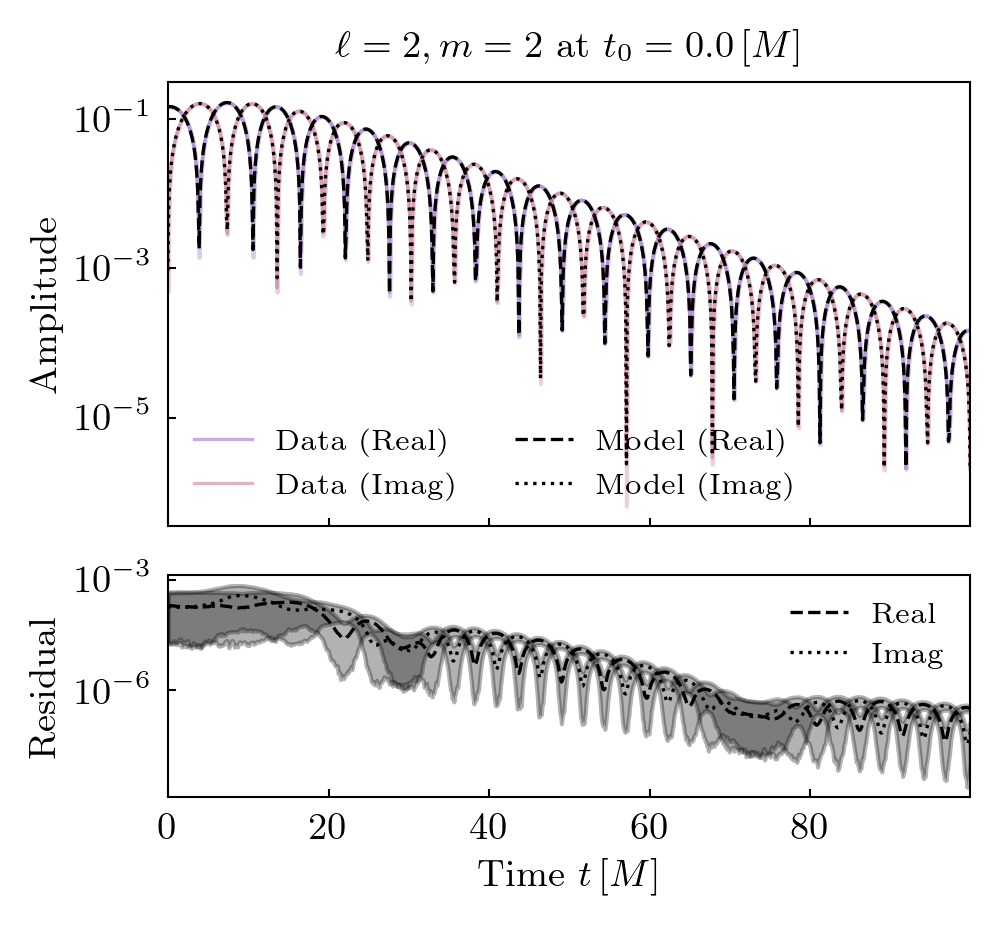
Fits
Model fits and data with residuals are shown. Start time is the earliest step at which the model fits well.
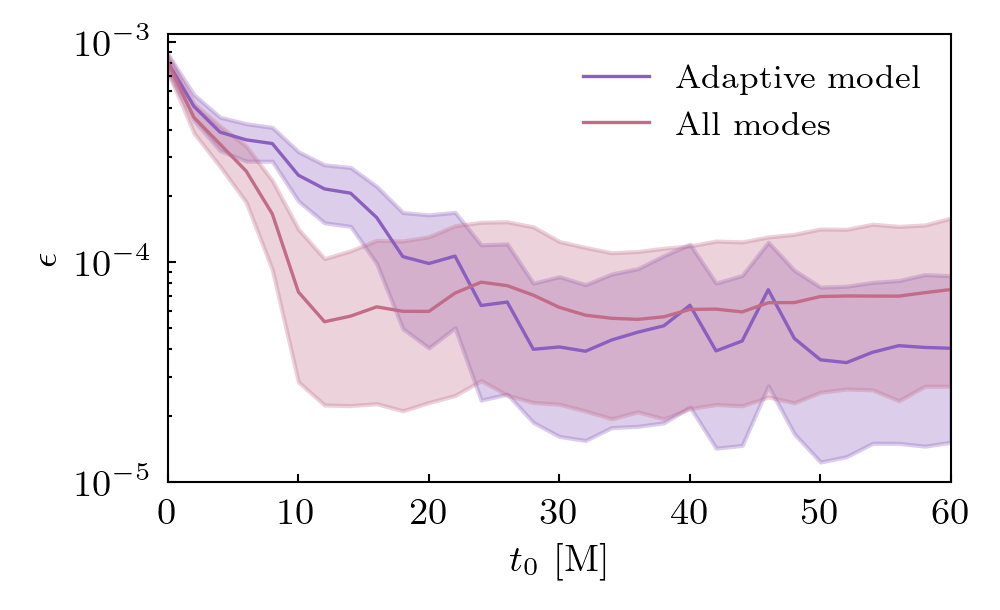
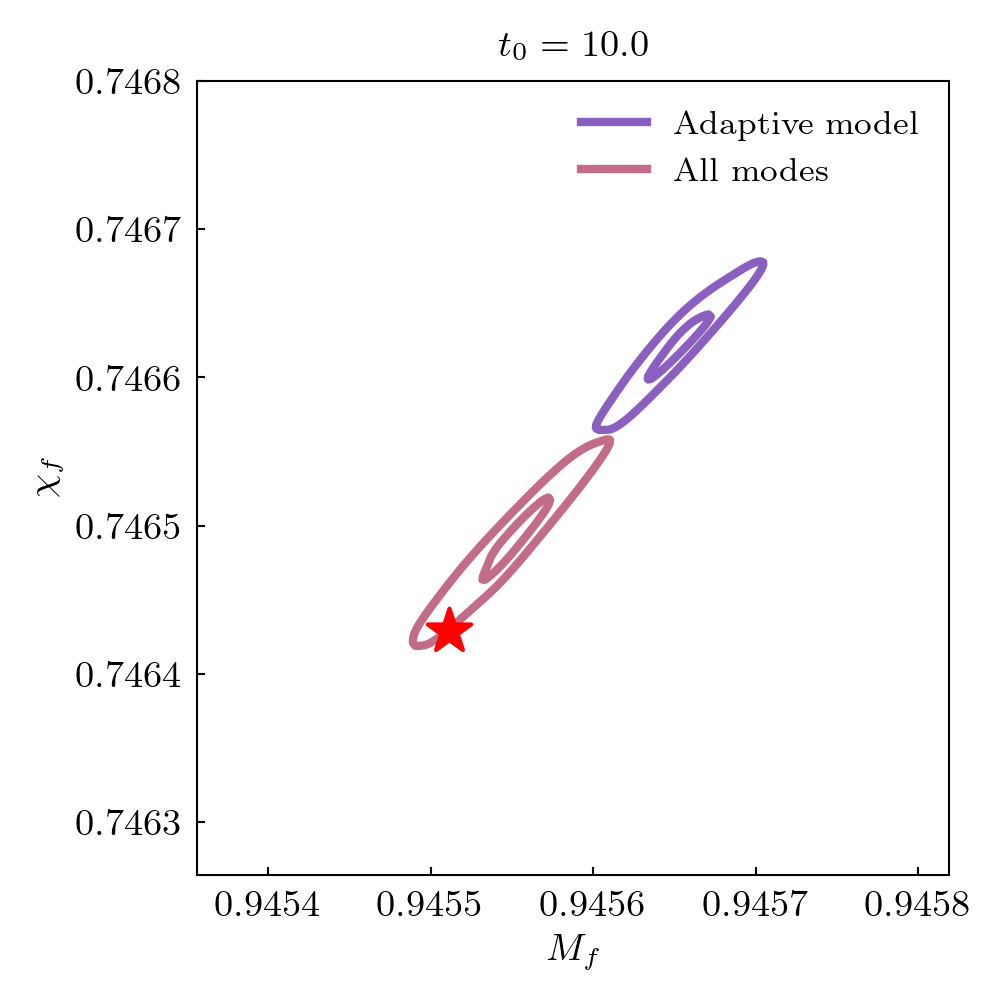
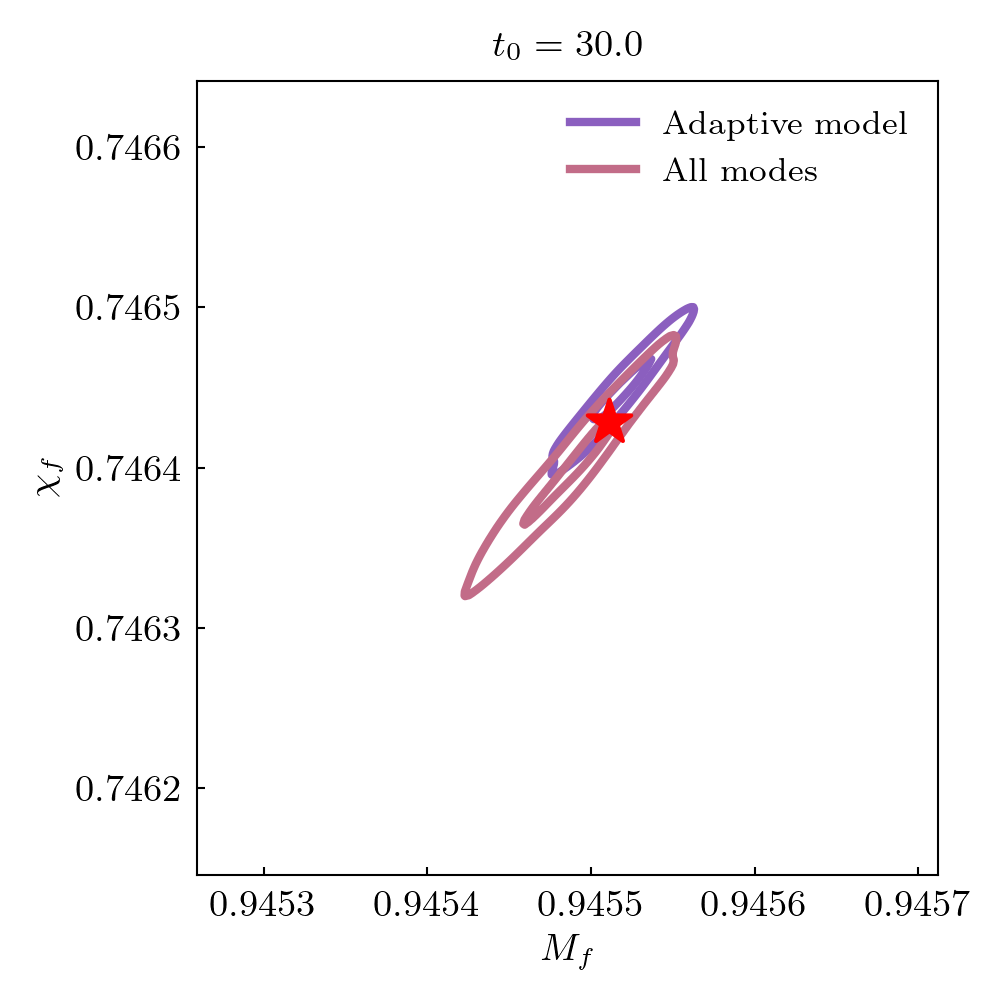
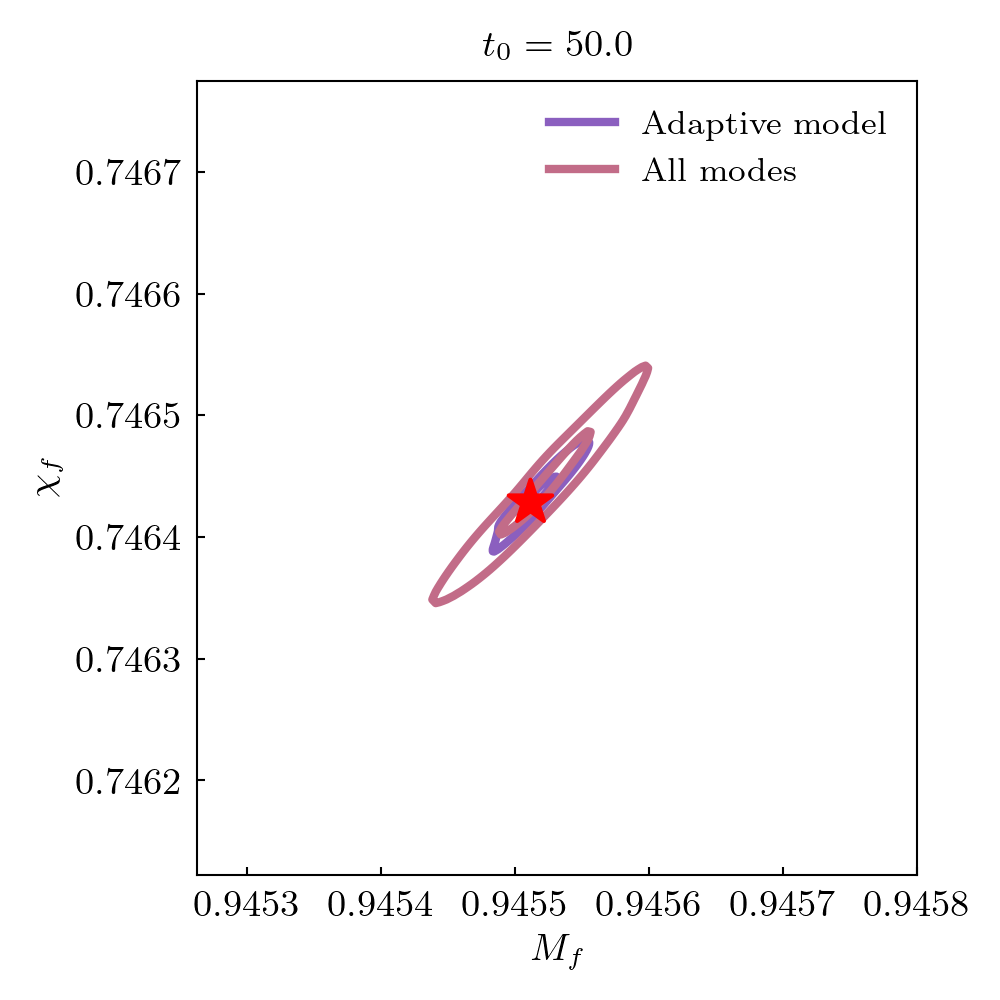
Epsilon
Remnant black hole mass and spin estimates are compared to NR values. Root square distance and posteriors at different start times are shown. The star indicates the NR value.